Mastering the Python Debugger (pdb): A Comprehensive Guide

Introduction to pdb
The Python Debugger (pdb) is a powerful tool that helps you understand the execution flow of your Python code, inspect variables, and identify the root cause of errors. It provides an interactive environment where you can examine the program’s state at any point.
Basic Usage
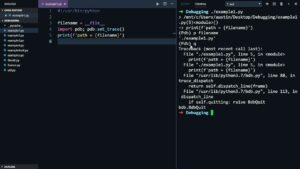
To use pdb, import it and call pdb.set_trace() at the desired breakpoint.
import pdb

def my_function(x):
    pdb.set_trace()
    result = x * 2
    return result

my_function(5)
When the code reaches pdb.set_trace(), the debugger will pause execution, and you’ll be presented with a pdb prompt (usually (Pdb)).
Navigating the Debugger
Once in the debugger, you can use various commands to inspect and control the code execution:
l(ist): List source code around the current line.n(ext): Execute the next line of code.s(tep): Step into a function call.c(ontinue): Continue execution until the next breakpoint.r(eturn): Continue execution until the current function returns.q(uit): Quit the debugger.p(rint) expression: Print the value of an expression.pp expression: Pretty-print the value of an expression.c(locals): List local variables.g(lobals): List global variables.b(reak) [filename:]lineno: Set a breakpoint at the specified line.cl(ear): Clear all breakpoints.h(elp): Get help on a command.
Advanced Debugging Techniques
- Conditional Breakpoints: Set breakpoints that only trigger when a certain condition is met.Python
import pdb def my_function(x): if x > 10: pdb.set_trace() # ... - Breakpoints on Exceptions: Set breakpoints when specific exceptions occur.Python
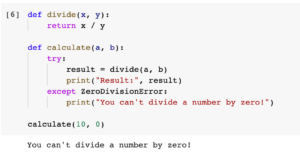
import pdb def my_function(): try: # ... except ValueError: pdb.set_trace() - Post-mortem Debugging: Start the debugger after an exception has occurred.Python
import pdb try: # ... except Exception: pdb.post_mortem() - Remote Debugging: Debug code running on a different machine using
pdb.set_trace()and a remote debugger client.
Debugging with IDEs
Most modern IDEs provide integrated debugging features that often leverage pdb. These features can offer a more user-friendly experience with visual debugging tools and additional functionalities.
Debugging Tips and Best Practices
- Set meaningful breakpoints: Avoid setting too many breakpoints. Focus on the areas where you suspect issues.
- Use conditional breakpoints effectively: This can save you time by avoiding unnecessary stops.
- Leverage the
pandppcommands: Inspect variables carefully to understand their values. - Explore the call stack: Use the
wherecommand to examine the function call hierarchy. - Take advantage of IDE integration: If available, use the IDE’s debugging features for a better experience.
- Practice regularly: The more you use pdb, the better you’ll become at debugging.
Beyond pdb: Advanced Debugging Tools
While pdb is a powerful tool, there are other options for more complex debugging scenarios:
- ipdb: An enhanced version of pdb with additional features like tab completion and syntax highlighting.
- pdb++: Another enhanced version of pdb with improved usability.
- PyCharm debugger: A graphical debugger integrated into the PyCharm IDE.
- Visual Studio Code debugger: A powerful debugger with support for Python.
Conclusion
pdb is an invaluable tool for any Python developer. By mastering its commands and techniques, you can significantly improve your debugging efficiency and problem-solving skills. Remember to experiment with different approaches and leverage the strengths of your chosen development environment.