How to Visualize Simulation Results in ANSYS

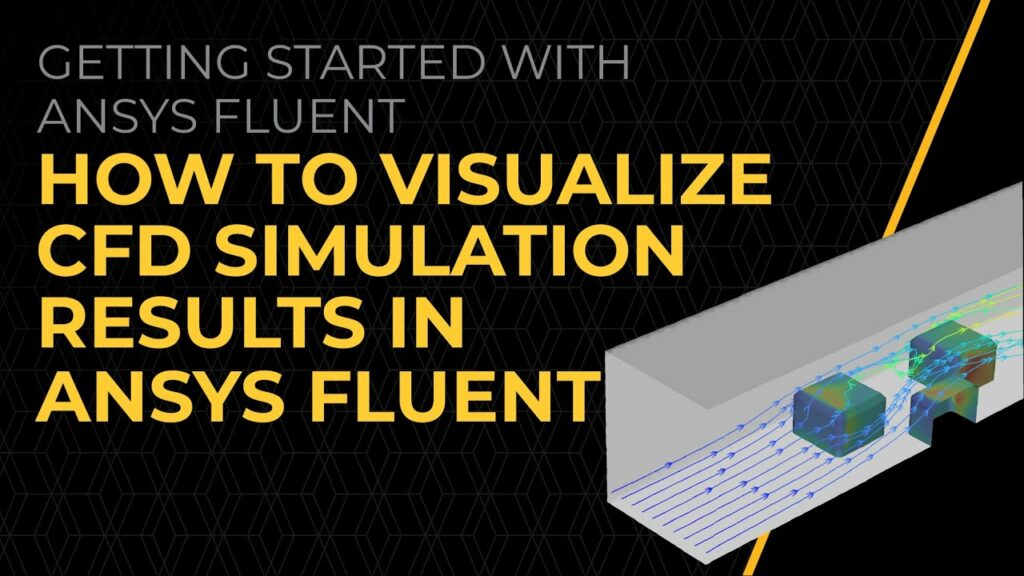
Visualizing simulation results in ANSYS is a critical aspect of engineering analysis, enabling engineers and analysts to interpret, understand, and communicate the behavior of complex systems and components. ANSYS offers powerful visualization tools that facilitate the exploration of various physical phenomena such as structural mechanics, fluid dynamics, electromagnetics, and thermal analysis. This comprehensive guide will cover the theory, techniques, tools, best practices, and advanced methods for visualizing simulation results effectively in ANSYS.
Table of Contents
- Introduction to Visualizing Simulation Results in ANSYS
- Types of Simulation Results in ANSYS
- Basic Techniques for Visualizing Results
- Advanced Visualization Tools in ANSYS
- Post-Processing and Data Analysis
- Customizing Visualization in ANSYS
- Best Practices for Effective Visualization
- Interactive and Dynamic Visualization
- Visualizing Multiple Physics Domains
- Conclusion
1. Introduction to Visualizing Simulation Results in ANSYS
Visualizing simulation results in ANSYS involves transforming numerical data obtained from simulations into graphical representations that are intuitive and insightful. Effective visualization enhances understanding of complex physical phenomena, aids in validation, and supports decision-making in engineering design and analysis processes.
2. Types of Simulation Results in ANSYS
- Structural Analysis: Results include stress distribution, deformation, displacement contours, and von Mises stress plots.
- Fluid Dynamics: Visualization of flow patterns, velocity vectors, pressure distribution, and turbulence characteristics.
- Electromagnetics: Magnetic field lines, electric field strength, flux density, and current density distributions.
- Thermal Analysis: Temperature contours, heat flux distribution, thermal gradients, and thermal stress analysis results.
3. Basic Techniques for Visualizing Results
- Contour Plots: Display scalar quantities such as stress, temperature, pressure, or velocity on a colored contour map.
- Vector Plots: Show vector fields such as displacement, velocity, or force using arrows or streamlines.
- Deformation Visualization: Illustrate structural deformations using exaggerated scaling or animated deformations.
- Slice Plots: Visualize cross-sectional views of results within the geometry to examine internal fields or gradients.
4. Advanced Visualization Tools in ANSYS
- Animation: Create time-dependent animations to visualize transient behavior over simulation time steps.
- Particle Tracing: Track particles or tracers to analyze fluid flow paths, turbulence characteristics, or particle deposition.
- Surface Probes: Place probes on surfaces to monitor specific values such as pressure, temperature, or stress at selected points.
- Pathlines and Streamlines: Trace pathlines of fluid particles or streamlines to visualize flow patterns and vortex structures.
5. Post-Processing and Data Analysis
- Data Extraction: Extract numerical data from specific points or regions of interest within the simulation domain.
- Statistical Analysis: Calculate statistical metrics such as maximum, minimum, average values, and standard deviations of simulation results.
- Comparative Analysis: Compare multiple simulation cases or design iterations to evaluate performance improvements or deviations.
6. Customizing Visualization in ANSYS
- Color Maps: Choose appropriate color scales and legends to represent scalar quantities effectively.
- Plot Annotations: Add labels, titles, legends, and annotations to clarify visualized results and highlight key insights.
- View Manipulation: Rotate, zoom, pan, and slice through 3D models to examine results from different perspectives and angles.
- Exporting Images: Export visualizations as images or animations in formats suitable for presentations, reports, or further analysis.
7. Best Practices for Effective Visualization
- Clarity and Simplicity: Present visualizations in a clear, concise, and understandable manner to facilitate interpretation.
- Contextualization: Provide context and background information to aid viewers in understanding the significance of visualized results.
- Consistency: Maintain consistent visual styles, scales, and formats across different types of visualizations and simulation cases.
- Interactive Exploration: Enable interactive tools for users to manipulate and explore visualized data dynamically.
8. Interactive and Dynamic Visualization
- Interactive Controls: Implement interactive controls for users to adjust parameters, filter data, and explore results interactively.
- Dynamic Updates: Update visualizations in real-time or based on user inputs to reflect changes in simulation parameters or conditions.
- Cross-Platform Compatibility: Ensure compatibility with different devices and platforms for seamless visualization access and usability.
9. Visualizing Multiple Physics Domains
- Coupled Physics Visualization: Integrate and visualize results from multiple physics domains (e.g., fluid-structure interaction, thermal-electromagnetic coupling).
- Overlay and Compare: Overlay results from different simulations or physics domains to identify correlations and interactions.
10. Conclusion
Visualizing simulation results in ANSYS plays a pivotal role in engineering analysis and design optimization, enabling engineers to gain insights into complex phenomena, validate designs, and make informed decisions. By utilizing the diverse visualization tools and techniques offered by ANSYS, engineers can effectively communicate simulation outcomes, identify design improvements, and optimize product performance across various industries. Mastering visualization techniques enhances the efficiency of engineering workflows, promotes innovation, and contributes to the development of reliable and high-performance products that meet stringent design requirements and exceed customer expectations.


